|
Sample Images and Results |
|
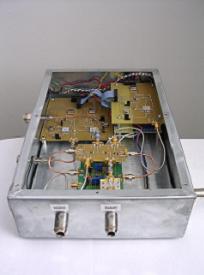
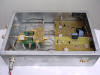
Fully assembled Radar Box; containing Transceiver
System and Control System Hardware -
Front View |
 |
|
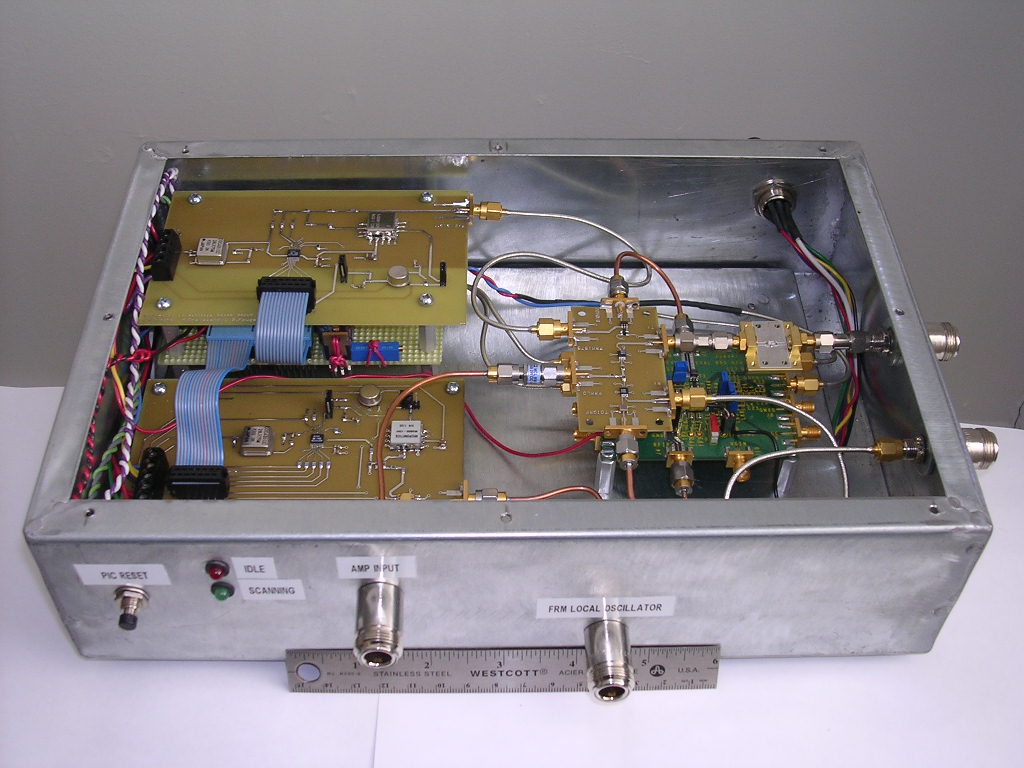
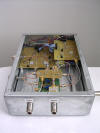
Radar Box - Rear View |
 |
|
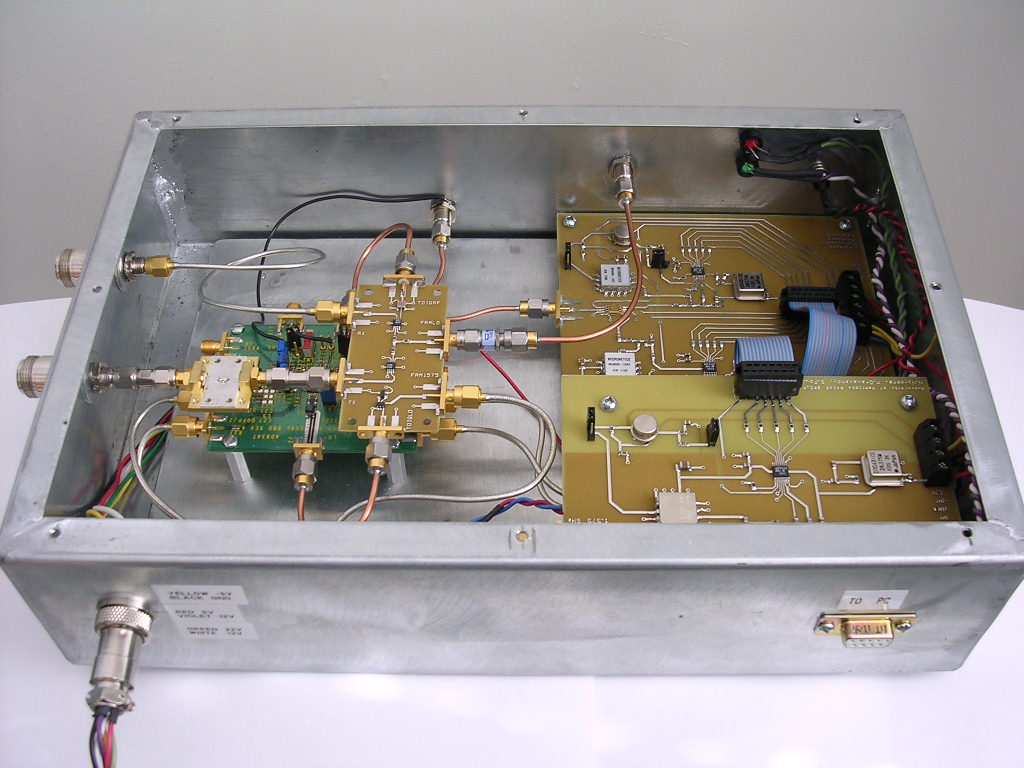
Radar Box - Side View |
 |
|
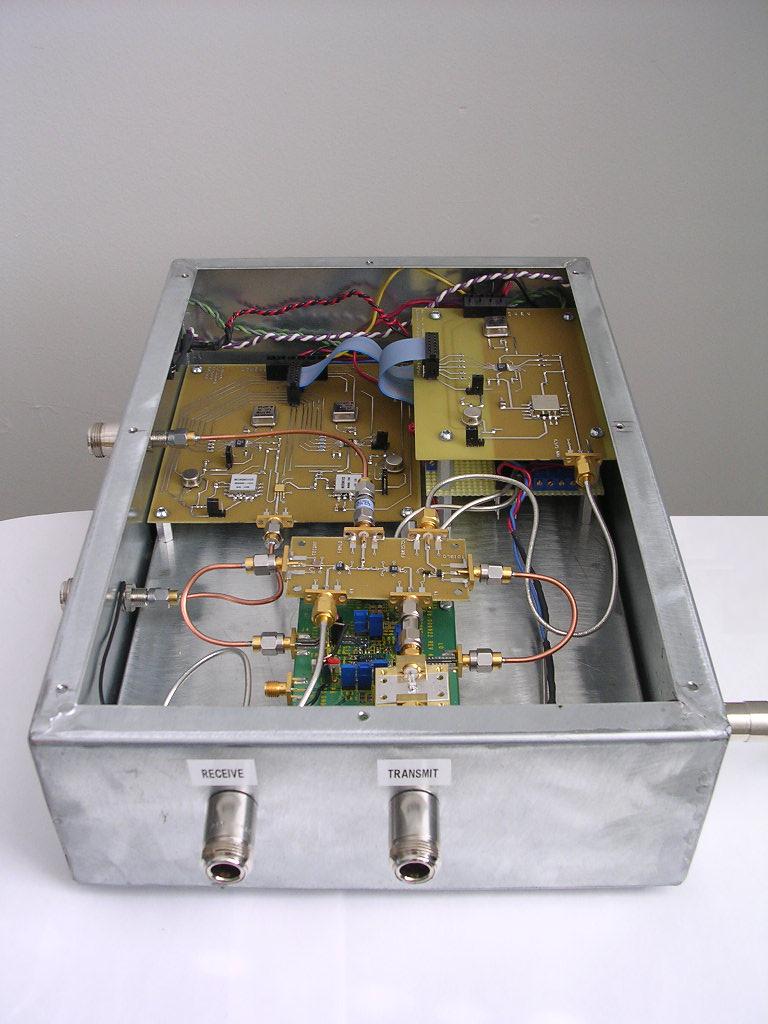
Radar Box - Top View |
 |
|
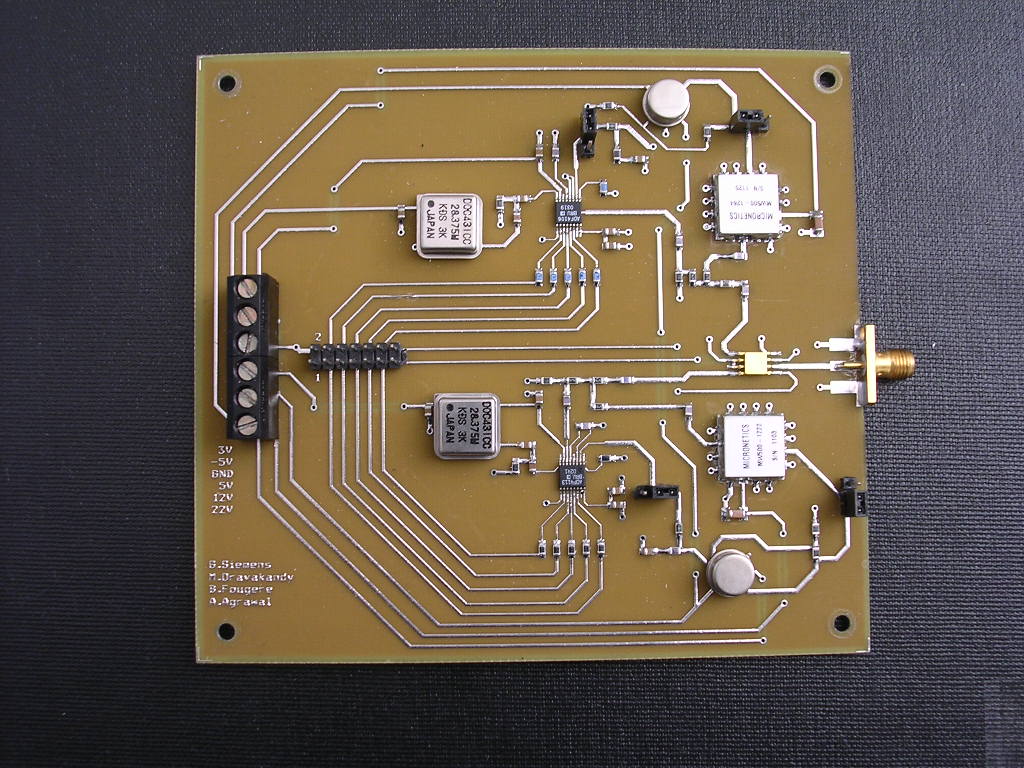
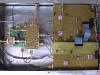
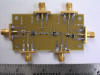
Digitally controlled Local Oscillator Phase-Locked
Loop (PLL) Board tuneable between 2.5 - 4.5
GHz. |
 |
|
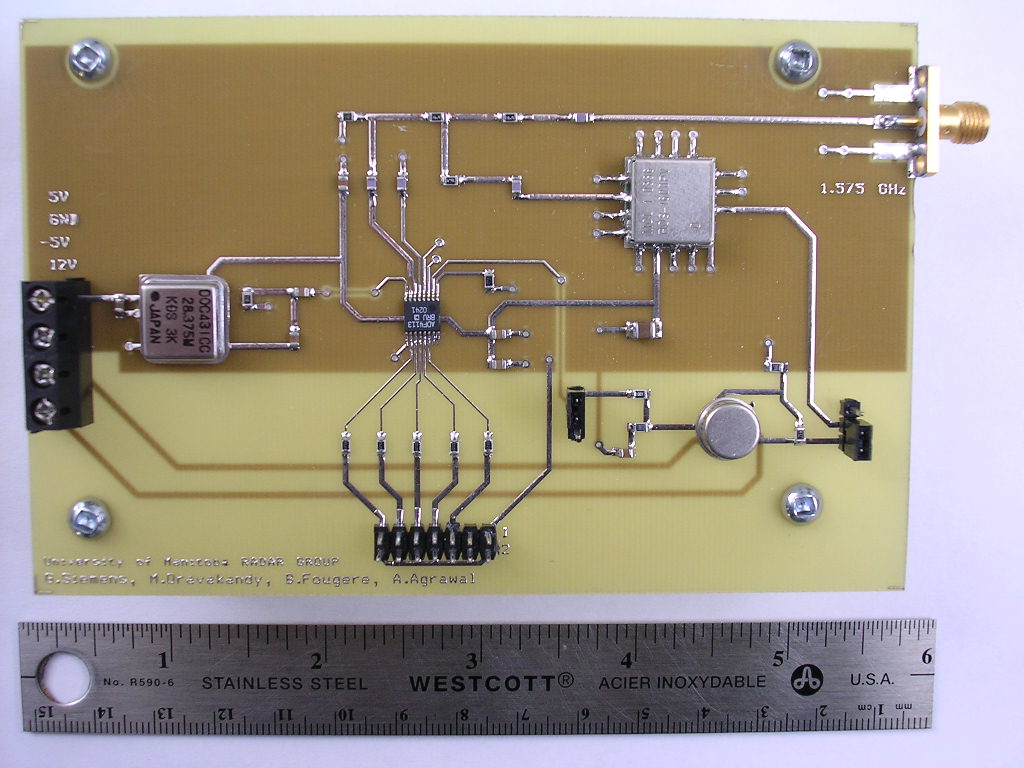
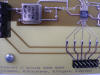
Digitally controlled Reference Intermediate
Frequency PLL Board fixed at 1.575 GHz. |
 |
|
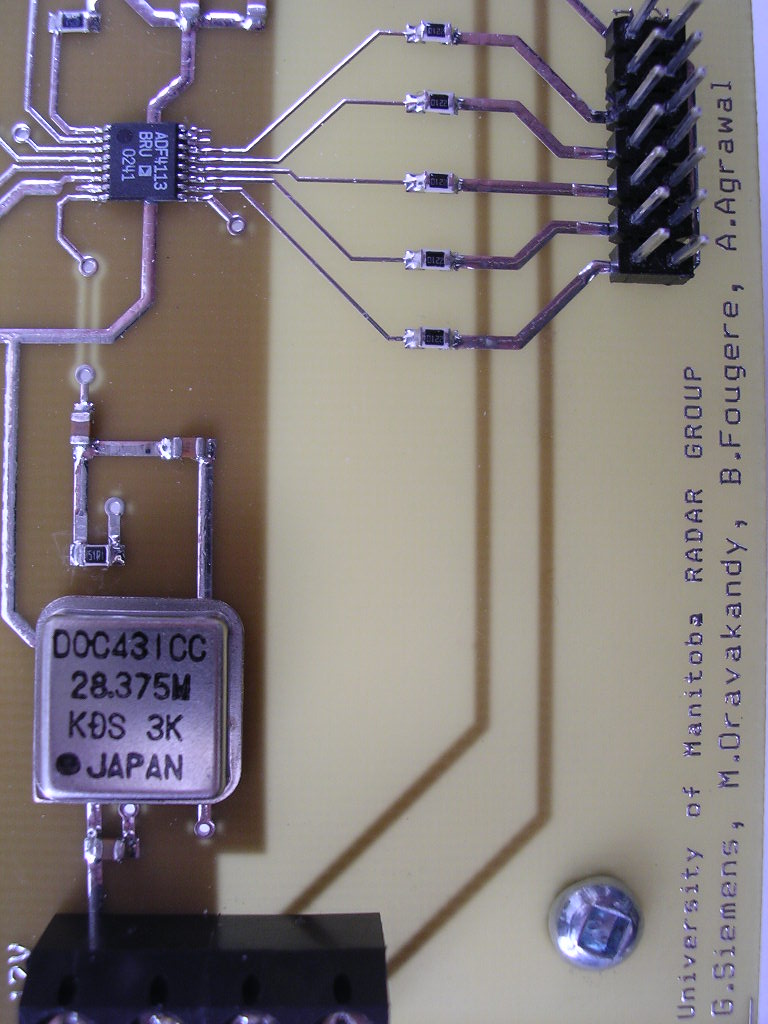
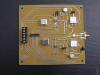
All Printed Circuit Boards were designed by the
University of Manitoba Radar Group, with the
exception of the I/Q demodulator board. |
 |
|
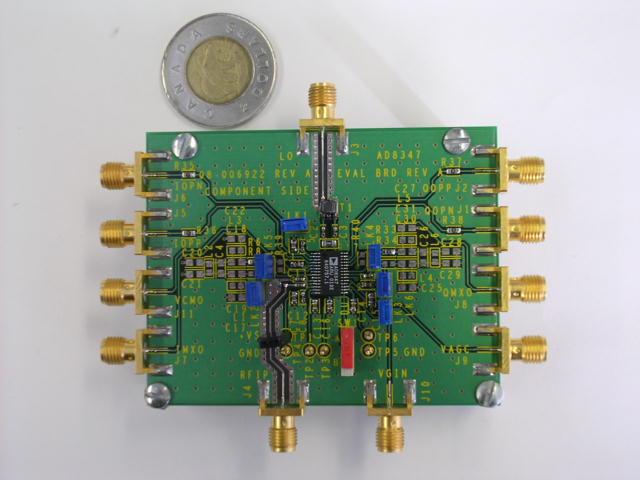
Passive components board |
 |
|
This board was used for our I&Q Demodulator |
 |
|
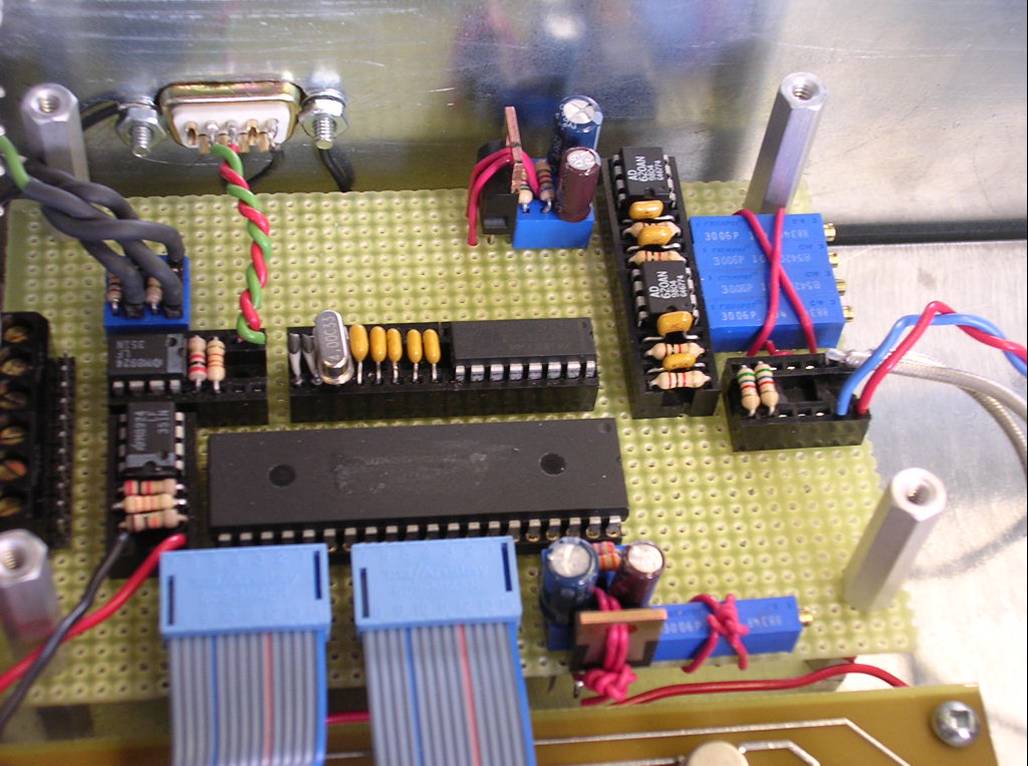
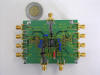
Control System Hardware Board - Top View.
This board interfaces the Radar Box with the
Personal Computer. Circuit implemented using
wire-wrap sockets on perforation board. |
 |
|
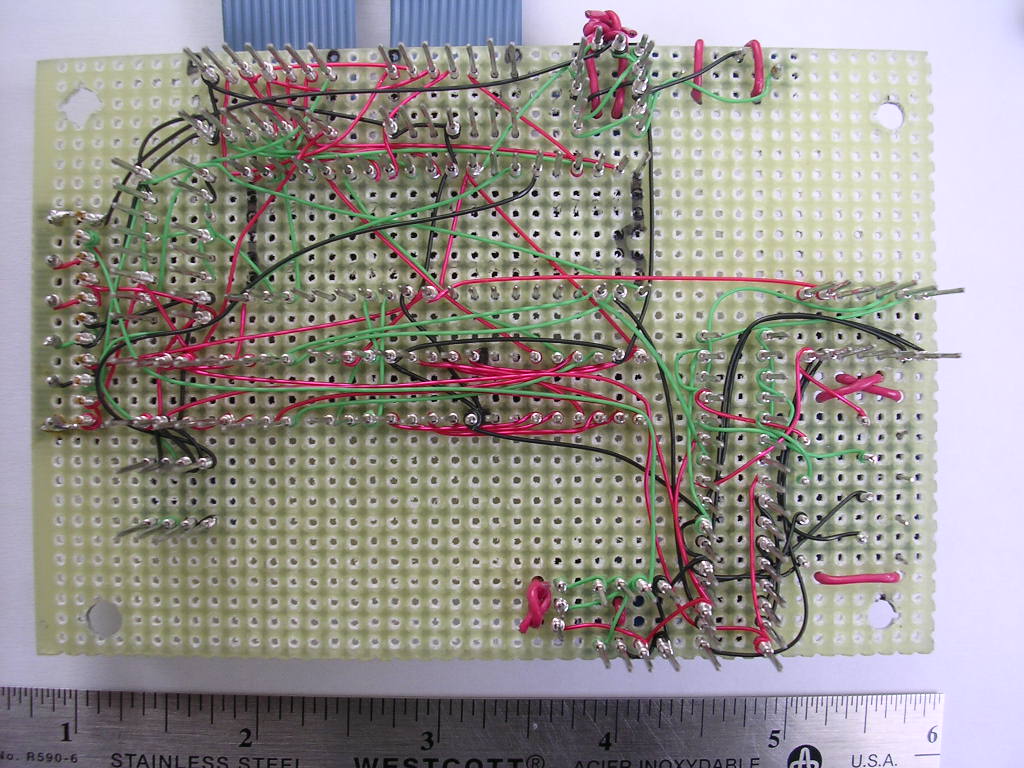
Control System Hardware Board - Bottom View. |
 |
|
This is the snapshot of the Graphical User
Interface (GUI) used for complete automation of
the system. |
 |
|
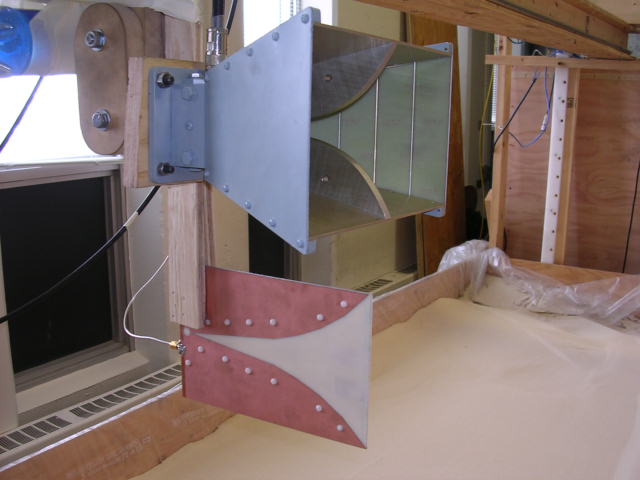
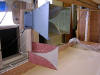
Test Environment with bi-static antenna
configuration. Horn Antenna was used for
Transmitting, and the Vivaldi Antenna was used
for Receiving. |
 |
|
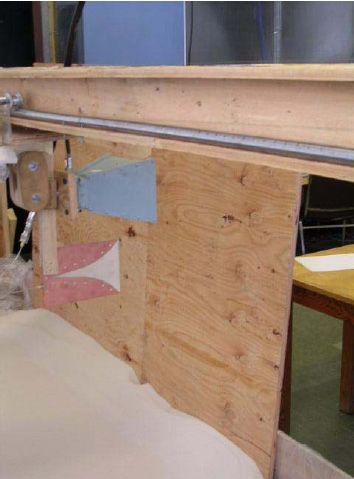
Antennas are mounted on rails for automation of
scans. Note the 1 inch plywood wall used for
testing. |
 |
|
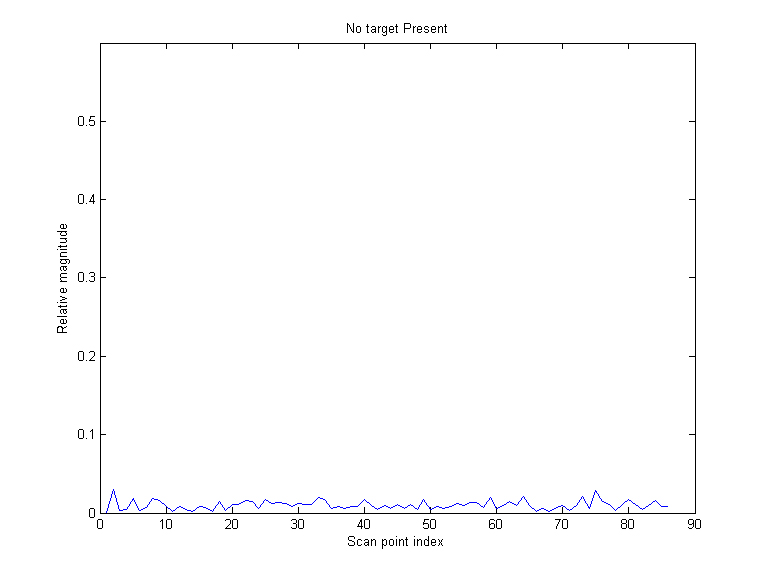
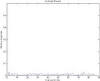
Scan showing the noise floor of two scans
subtracted from each other that cancels out
common features. |
 |
|
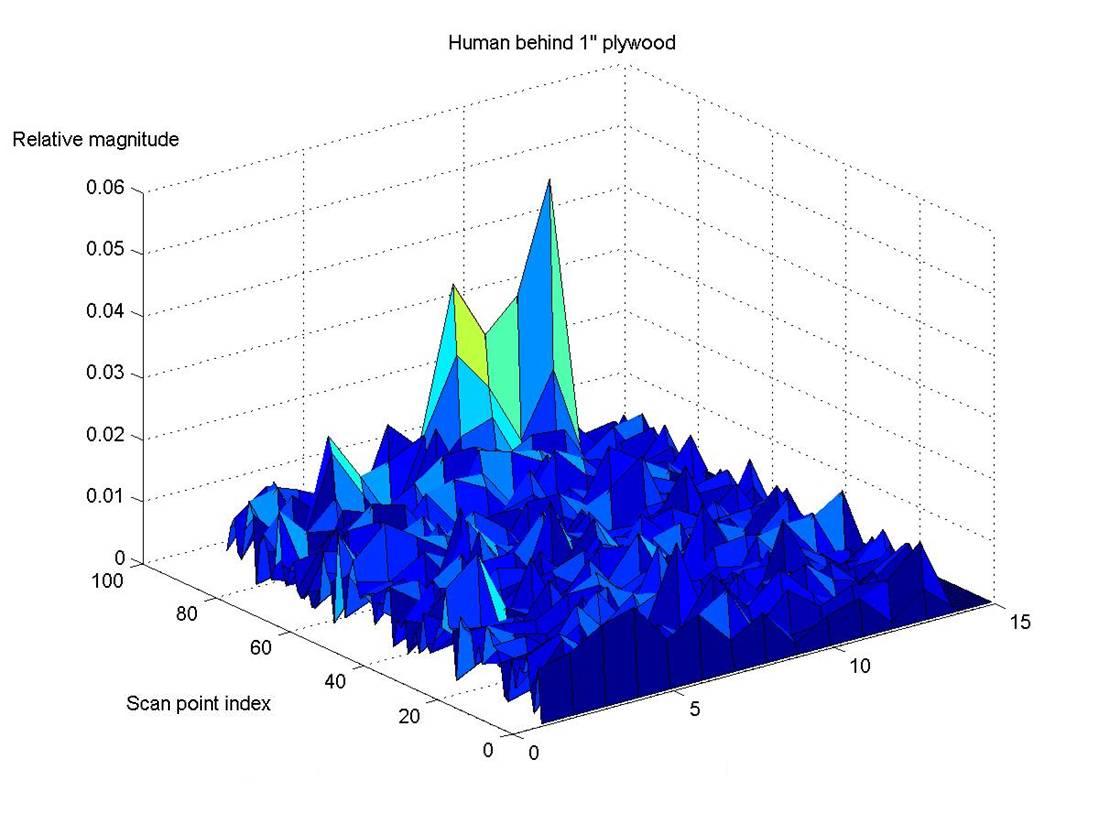
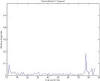
Scan showing the presence of a human target with
respect to the noise floor. |
 |
|
Measured response of a human
behind the plywood wall. Plotted using multiple
scan points over a horizontal range. |
 |
|
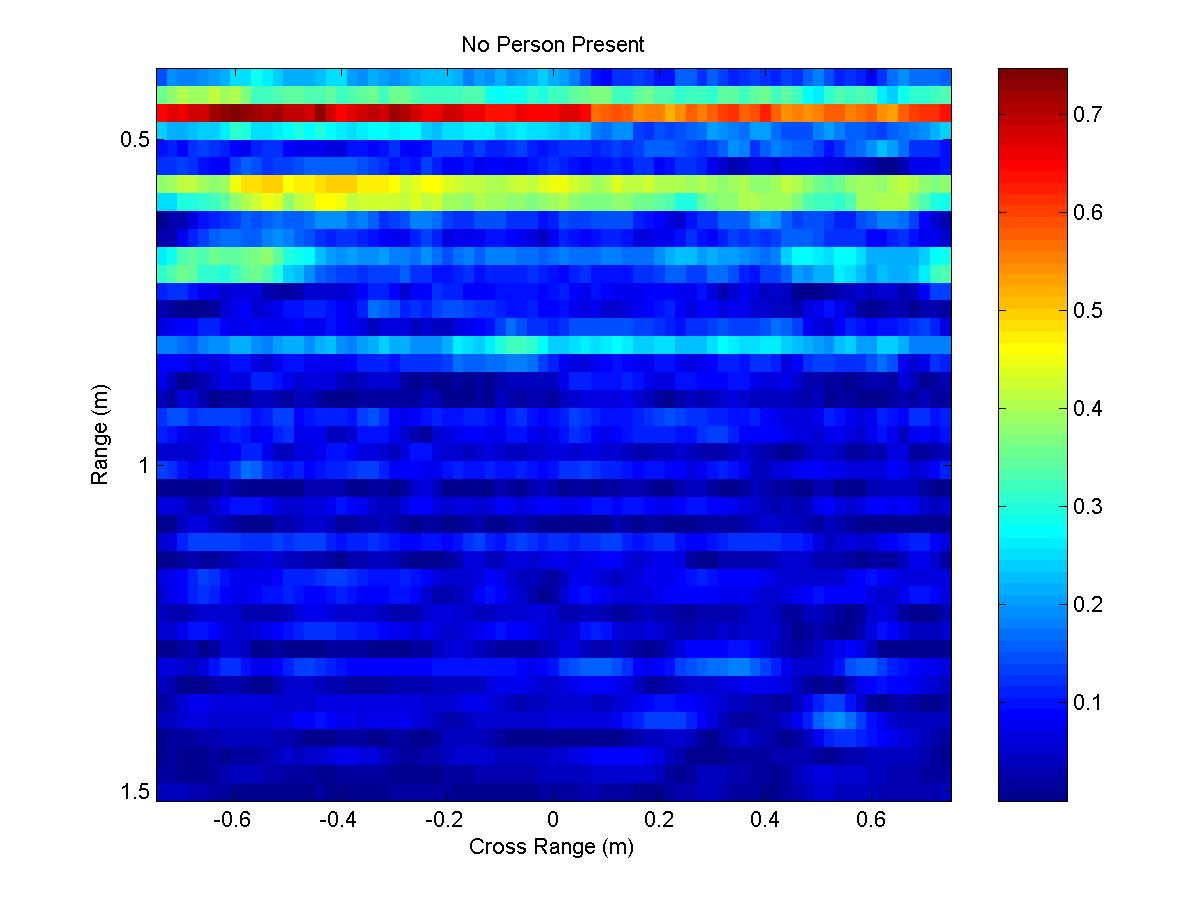
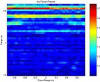
Image captured using
a Vector Network Analyser (VNA) and the Synthetic
Aperture Radar (SAR) technique. The red band
shows the presence of the plywood wall. |
 |
|
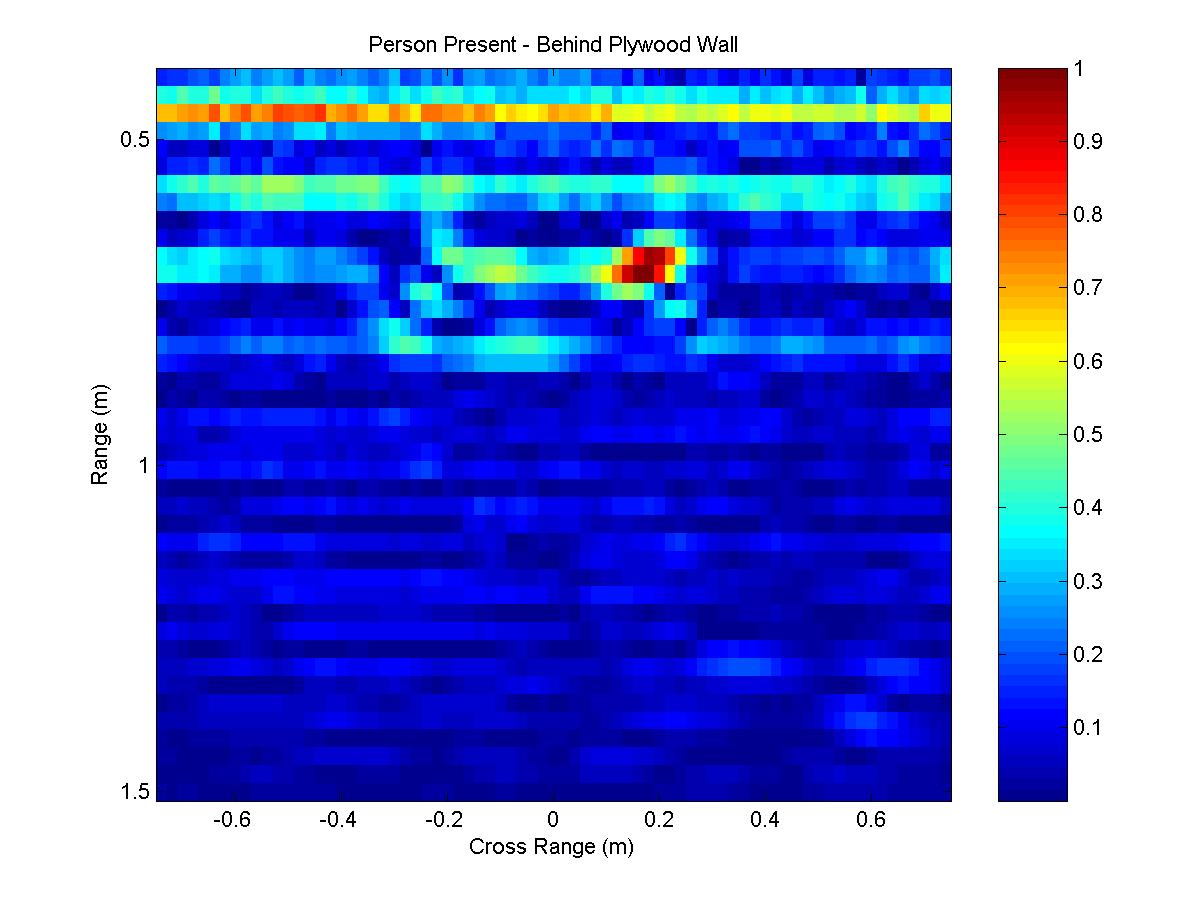
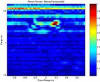
Image captured using the VNA and SAR. The
disturbance in the center of the image indicates
the presence of a human. |
 |